New interactive map shows impact of UNC research in NC
The Office of Research Communications has developed a resource to help demonstrate the impact of Carolina's research in our state.
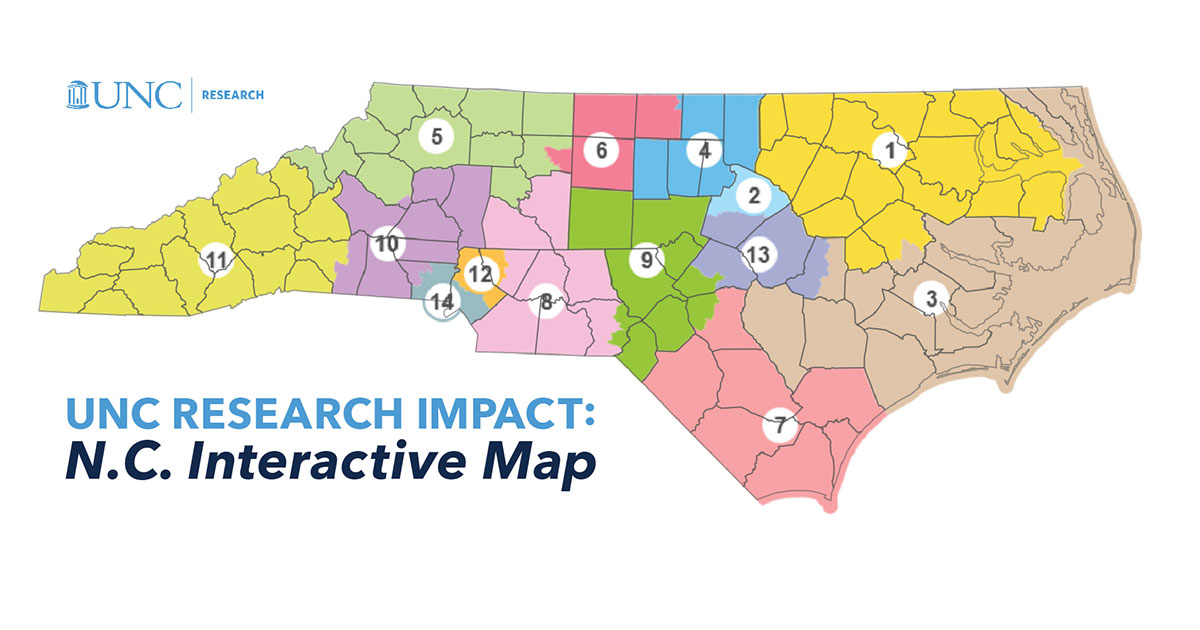
A new interactive map of North Carolina, hosted on the UNC Research website, shows the presence of Carolina's research enterprise in each county. It is divided by U.S. Congressional Districts for easy navigation.

With this map you can:
- Hover your cursor over a county to see its name
- Click on the county for a brief research impact summary
- Click the "Read more" button in the summary to visit that county's full research impact page. These individual pages are designed for easy, one-page printing.
The statistics included on the full research impact pages are:
- The amount of research funding for projects benefitting that county (over five fiscal years)
- The number of undergraduate students participating in research activity (classes participating in IDEAs in Action curriculum)
- The number of research projects taking place there (most recent fiscal year)
- The number of residents employed through Carolina research activity (most recent fiscal year)
This web tool is designed to be a central location for information on UNC-Chapel Hill research impact. Links to other research impact websites are also included to provide users with a one-stop-shop experience. As this resource grows and evolves, the Office of Research Communications welcomes your input and collaboration.
View the interactive map at research.unc.edu/impact.